Monitoring with the help of Telegraf, Influxdb and Grafana
This article will help you with how to monitor your system with Telegraf, influxdb and grafana. I have used my ubuntu system for performing these tasks described in the article. This might not work for other Operating systems and distributions.
Installation -
Telegraf :
Telegraf is a light-weight agent for collecting system metrics of the system. Telegraf’s function is to collect your real time stats about your system and output them to a database so that you can store them, and further visualize them via some visualization tool.
You can easily install it.
Firstly, download its deb package with wget command,
$ wget https://dl.influxdata.com/telegraf/releases/telegraf_1.3.2-1_amd64.deb
Then, install this deb package with the help of dpkg command,
$ sudo dpkg -i <span color:'blue'>telegraf_1.3.2-1_amd64.deb</span>
This will install telegraf on your system.
Influxdb:
Influxdb is a Time Series Database. It stores data according to the time at which it was registered. So, it is perfect for storing the system stats as we can see what was happening at a particular moment in time. Here we will use it for storing system metrics.
Download its debian package,
$ wget https://dl.influxdata.com/influxdb/releases/influxdb_1.2.4_amd64.deb
Then install this package,
$ sudo dpkg -i influxdb_1.2.4_amd64.deb
This would install influxdb into your system. Influxdb server runs at port 8086 by default.
Grafana:
Grafana is a perfect tool for visualization of the metrics in your Time Series Database. It queries data from your database and shows that by beautiful and interactive dashboard panels.
Add this line to your /etc/apt/sources.list file,
$ deb https://packagecloud.io/grafana/stable/debian/ jessie main
Then, add its key for installing the signed package,
$ curl https://packagecloud.io/gpg.key | sudo apt-key add -
Then update your repos and install grafana,
$ sudo apt-get update
$ sudo apt-get install grafana
Grafana will be installed in your system. Grafana server runs on port 3000 by default.
Configuring Our Tools :
Configuring Telegraf:
Telegraf collects your system stats and outputs them to a database. It can output to a number of databases. Here, we will be using influxdb as the database.
Telegraf is a plugin driven tool. It has plugins for output and input and every plugin is given in the configuration file, whichever plugin you want to enable you can comment out that and use it. The main telegraf conf file is , /etc/telegraf/telegraf.conf file,
There are some global settings for telegraf agent at the starting, and then settings for each plugin. The default global settings work well for most of the scenarios. We will configure the influxdb output plugin here,
[[outputs.influxdb]]
  urls = ["localhost:8086"]
  database = "telegraf"
  retention_policy = ""
  username = "test"
  password = "test"
Here, url is the socket address where influxdb server is running. Influxdb runs on port 8086 by default. If influxdb is placed at some other server, replace localhost by your server’s IP address.
Next is the name of database in influxdb where you want to store the data.
Retention Policy is for how much time you want to keep your data. Read more about it here.
If you have enabled basic auth for writing to influxdb, give username and password in the config.
This is enough to send data to influxdb. Now, start your telegraf agent so that it can start collecting your system stats.
$ sudo service telegraf start
By default, telegraf collects system data only about important things. You can configure it to collect data about other applications also. That will be discussed in other article.
Configuring Influxdb:
You don’t need to do any kind of manual configuration on influxdb to listen to data coming from telegraf. Just make sure that it is running on port 8086.
$ sudo service influxdb start
Configuring Grafana:
Grafana also does not need any kind of extra configuration. Run grafana server on your system.
$ sudo service grafana-server start
Grafan server runs on port 3000. Now, we will look closely how to use different features of grafana.
Making Our First Dashboard:
In your browser, go to localhost:3000(or your system IP),
Login to grafana. The default username is admin and password is admin.
First of all, you have to tell Grafana that from where your data will be coming. So, we have to add a data source. So, select Add Data Source.
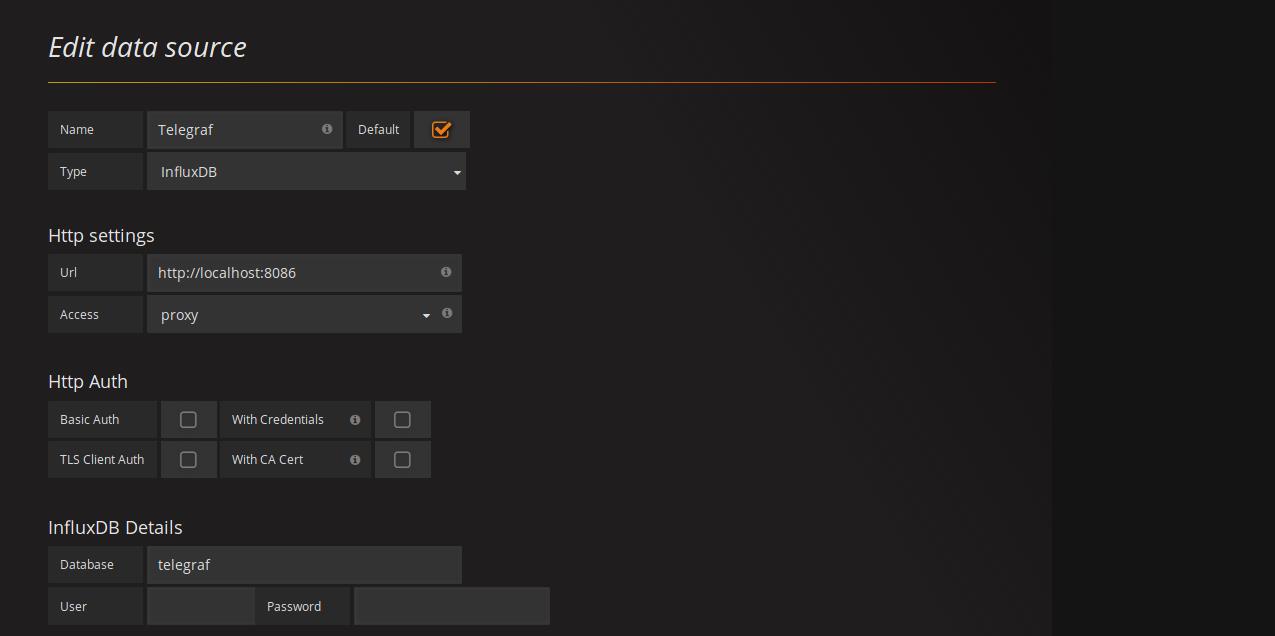
Here, select the type of database you are adding i.e, influxdb. Write down the name of data source. Here this name is not the name of database in influxdb, it is the name which will be shown in Grafana only.
Then, write the address of influxdb socket. Grafana will query data through this url. Select the type of access to grafana. Direct means you are using it directly from browser and proxy means grafana is being hosted behind a proxy server.
Then write the name of database in influxdb where data is stored. We have named it “telegraf”. Write username and password if you have enabled basic auth for influxdb.
Click Save and Test. If everything entered is correct, it will show that it is working.
Now, We will add a new dashboard for the visualization of our system statistics. Click on Home button and then select Create New dashboard.
Select your desired kind of visualization i.e, Graph, singlestat, table etc.
Click on the panel title and edit this dashboard panel.
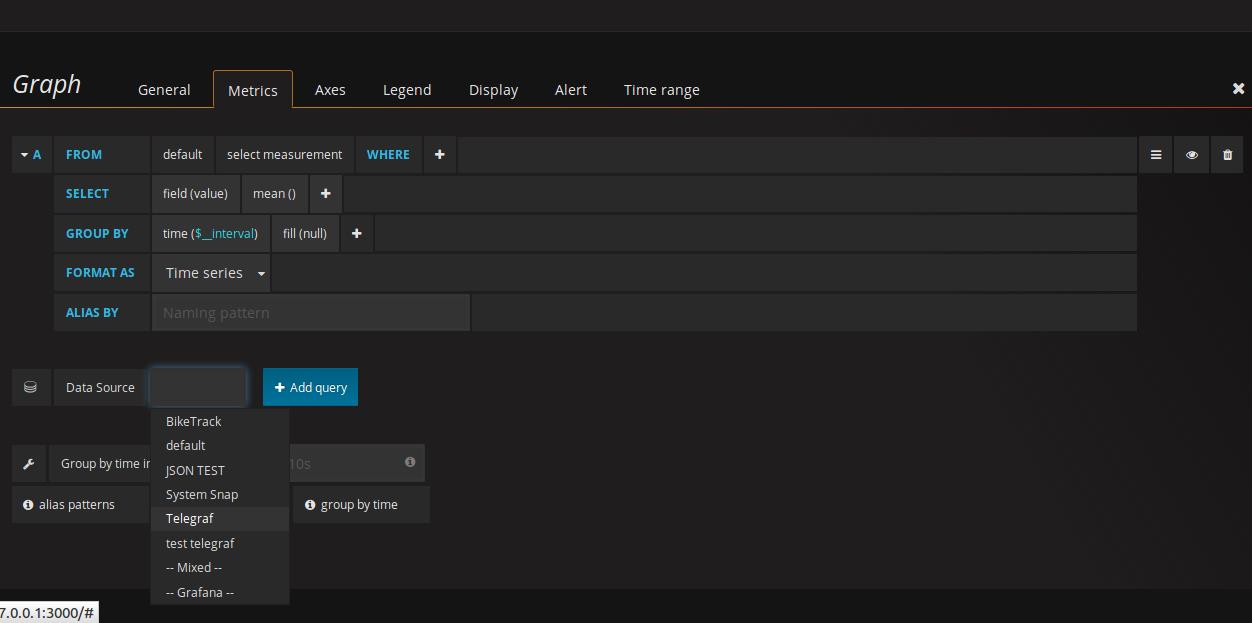
Select your data source which you added earlier. Then write the query through which you want to query specific data.
Here is an example,
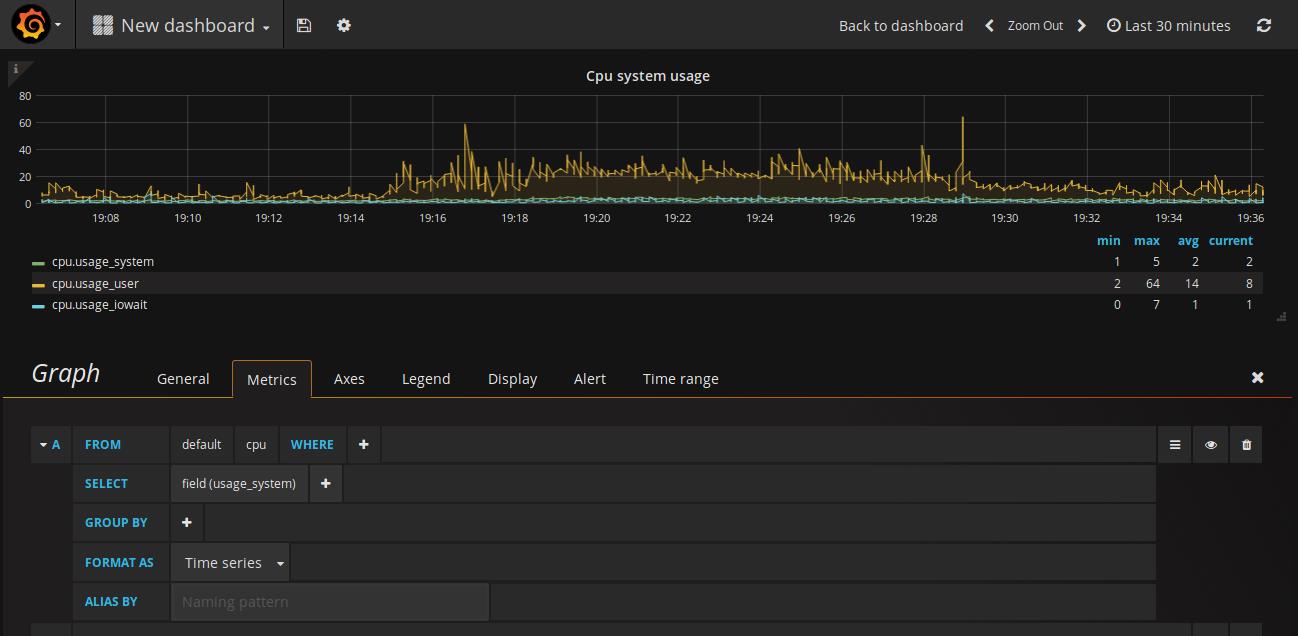
Here we have selected the cpu usage by the system. We can add more queries by clicking “ADD QUERY” button. We will
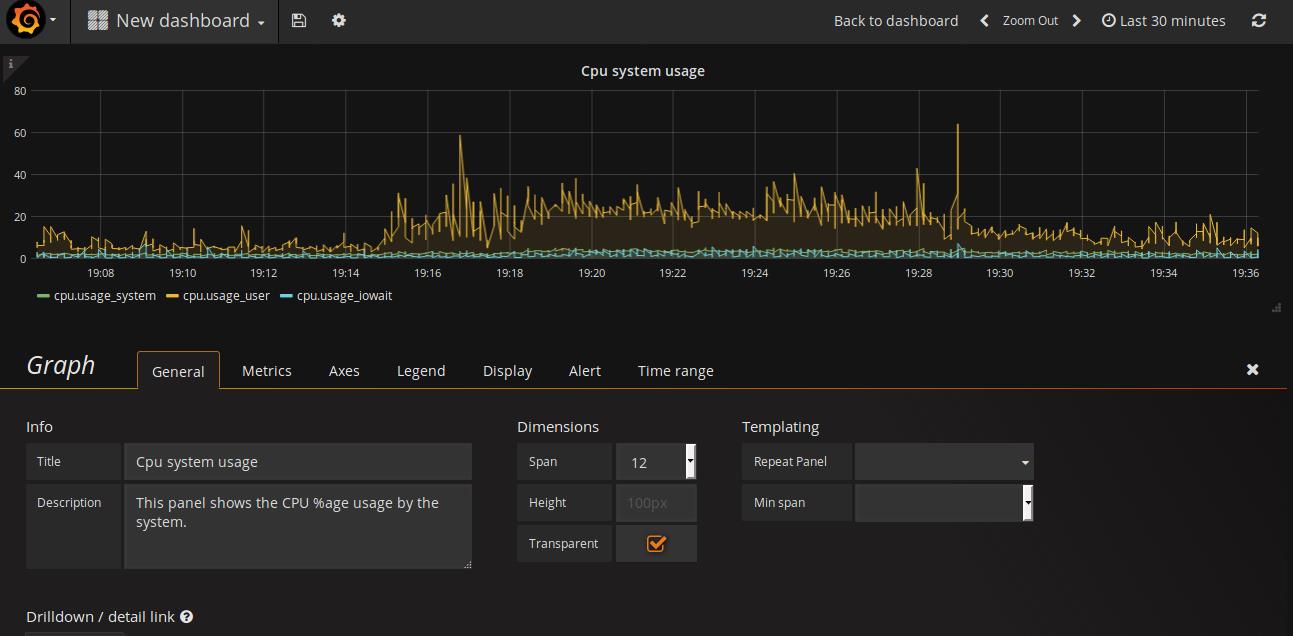
To change the name of the panel, go to general tab and write down the name of your panel. Here, you can describe something about your panel also, like, what does it show and what the values mean. You can make it transparent to make it more darker.
In the Legend tab, you can enhance your visualization by adding more values. You can add maximum, minimum, average and current values in the simple format OR in the table format.

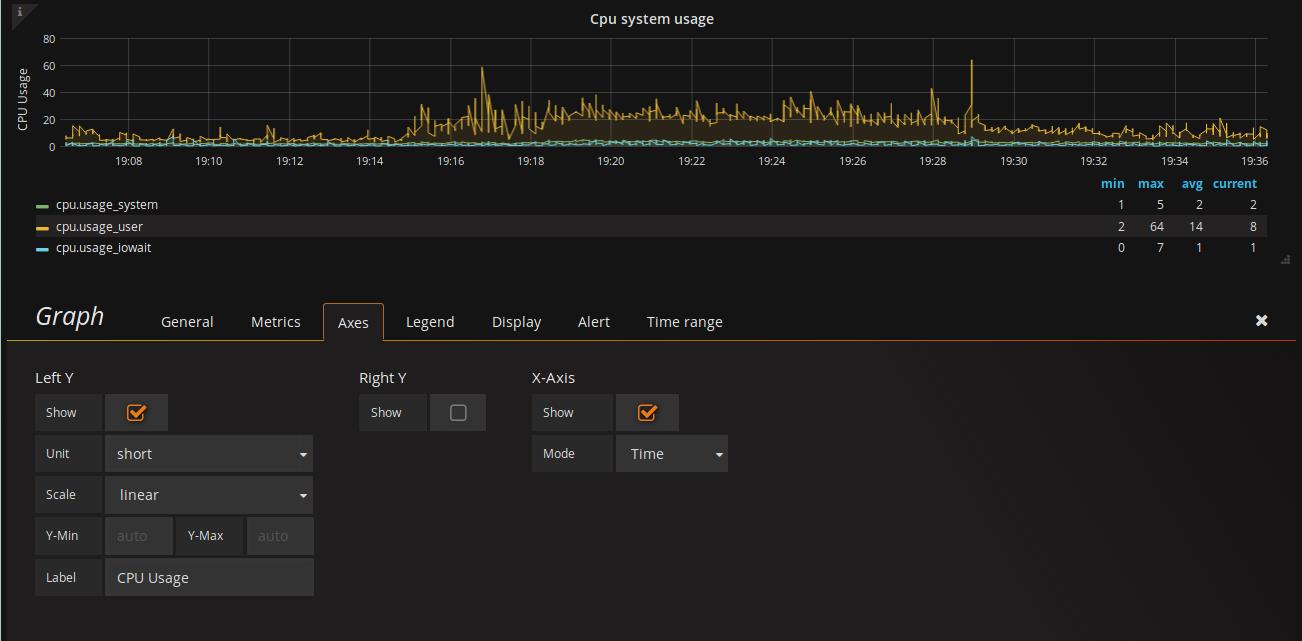
In the Axes tab, you can configure the units of the values of the metrics. Minimum and Maximum values can be set in here. The labels can also be set on the Y-axis.
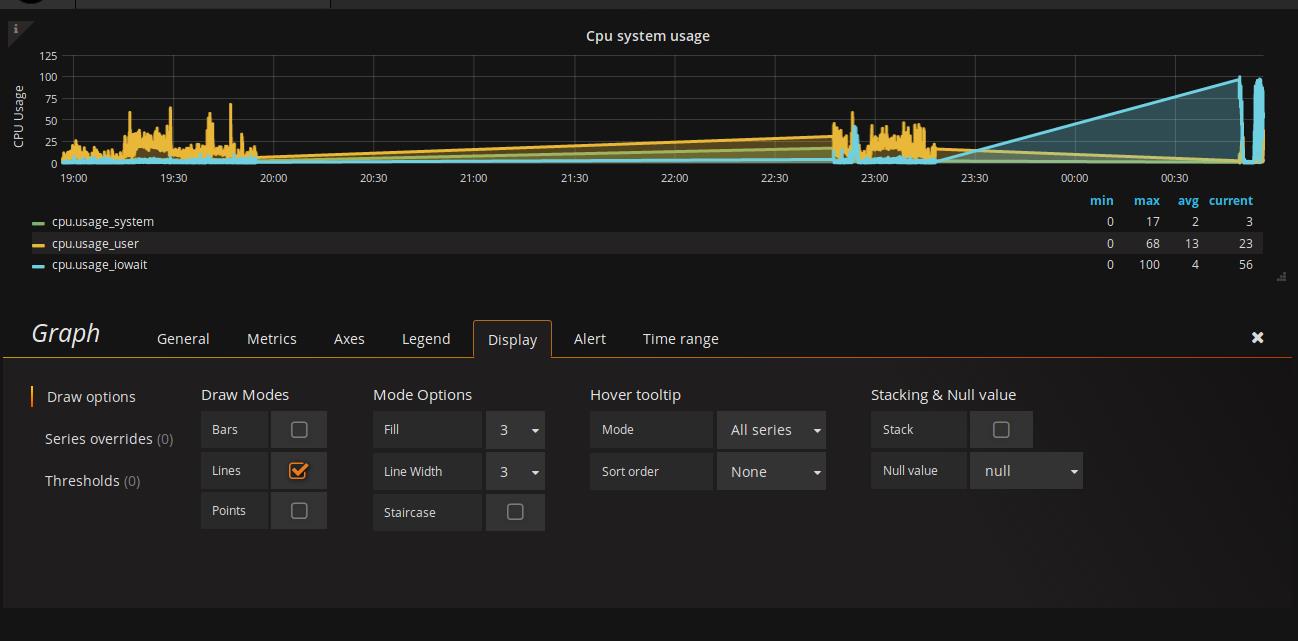
Next is the display tab, You can customize the look of your panel. If you want your data to be plotted in points, you can choose points instead of lines. And If you want bars, you can select bars. You can configure the width of the line and the density of the area under the line.
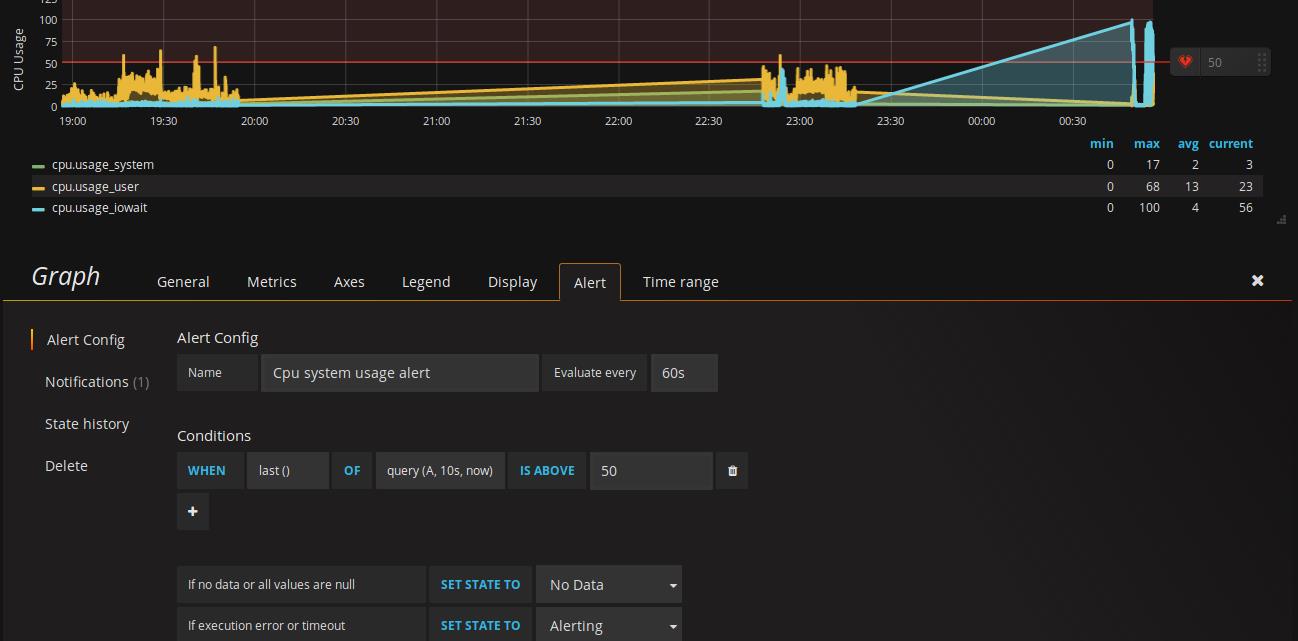
Alerts: Next is the alerts tab, here you can create alerts on the metrics. Suppose you want to be notified when the cpu usage of user goes above 50%, you can configure it do so. Many alerts can be added. You can add the method by which to get notified, like email, slack etc. in the notifications channel.
Your visualization is ready for you. Add all other stats of your system and make interactive panels.
So, this is how you can visualize your system stats using telegraf, influxdb and Grafana.