Monitoring without Netdata? Think again mate.
Before you read this, think for a moment, how you are monitoring your OS, applications, databases and web-servers.
Some months ago, my company asked me to build a system for monitoring the system and applications. There were many tools available like Nagios, Dynatrace, Munin and the new TICK stack. I started these and worked on them for few weeks. Made a system using these. To be honest, I struggled while doing this. The struggle was mainly due to 2 reasons, but only one was mine(I had no experience in this area). The other struggle was with these tools. Complex installation processes, tool documentation problems, configuring databases for their working and a lot of plug-in and plug-out work etc. Monitoring systems and applications is important, but if it is taking too much of your time and effort, then you are doing it the wrong way.
Then somebody over StackOverflow recommended me Netdata. With all respect to earlier mentioned tools, I never saw anything like Netdata before. At first glance, It seemed magical. I thought that this is something new in monitoring field for the DevOps. But slowly I realized(again, no disrespect to the other tools) that this is the tool which exactly fits the basic DevOps’ cultural philosophies. A tool so agile, flexible, smooth, electric, beautiful and reliable that it has become irreplaceable and has made hard to think of DevOps without Netdata.
Netdata
As said on it’s Github wiki, Netdata is a scalable, distributed, real-time, performance and health monitoring solution for Linux, FreeBSD and MacOS.
Netdata is more like a universal monitoring tool. It is a complete package. It has Data Collection + Data Storage + Data Visualization, all in it.
Netdata provides real-time monitoring of your system and applications by collecting metrics from them. Its architecture is fairly simple. It uses statsd system to collect metrics from your system. The statsd system and your applications connect through a UDP connection. Netdata does not use any kind of Disk space for storing these metrics. After the metrics are collected and processed by statsd, they are sent to RAM(by default). Yes, RAM. Netdata comes with a built-in web-server to display all your metrics with the help of beautiful dashboards.
 |
|---|
| Netdata Dashboard Overview |
The first step to use anything is installing it. So, install netdata first. Netdata provides a 1 line installation.
bash <(curl -Ss https://my-netdata.io/kickstart.sh)
That’s it. You don’t even need root access to install it. The moment it’s installation is completed, it is ready to use. No setup, no configuration is needed. Netdata setup is simple and saves much of your time. So, you can focus on other important things.
To see the Netdata dashboard, go visit the url localhost:19999 in your browser. The above installation command makes sure that you have all the features of Netdata installed in your system. By all I mean, the basic netdata features and also every netdata plugin will be installed in your system. Afterwards, you just need to configure the plugins according to your system and applications.
 |
|---|
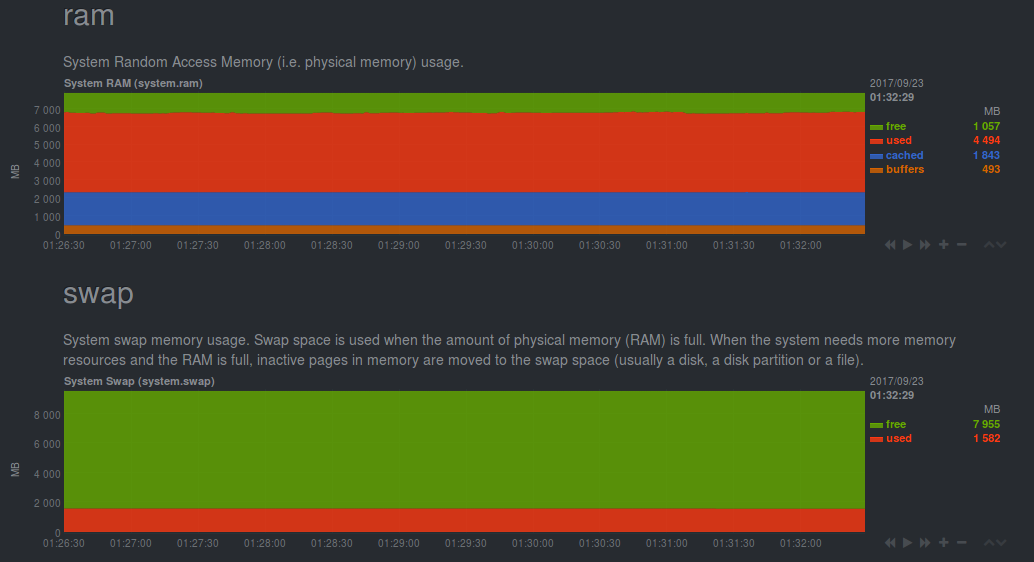
| RAM information |
Netdata is a configuration-less tool. As already told, it is ready to use right after installation. But The term “configuration-less” means much more than this. It’s fascinating meaning is that it can run without any configuration file. If you don’t believe this, delete your /etc/netdata/netdata.conf file, and run netdata. It will still be working. Read here why it works.
You see without any efforts, it is giving you live status of your system. Netdata monitors the network, disk, CPU and itself without the need of any configuration file. It tells about the status of CPU. It shows about each core that how much they are being utilized and by whom, also the number and types of interrupts. It monitors all the disks on your system. Tracking the disk writes, reads, free/used memory, free/used inodes and displaying them. It also oversees your network. Keeps an eye on networking interfaces, IPV4 and IPV6 stack in your machine. It even tells you about the temperature of your machine(desktop machines) and the rotation speed of your computer system exhaust fan.
 |
|---|
| Disk Usage Monitoring in Netdata |
These are provided by default. Well ofcourse, if you want to monitor your other applications you have to configure your corresponding netdata plugin accordingly. It has plugins for most of the applications you use. Netdata has all the plugins already installed in it and ships a default config file for each of them. The file is really simple to understand and it uses YAML syntax for each of it’s file. If some plugin is not working due to some reason, netdata also provides easy debugging options for all it’s plugins. So, it saves effort and time.
If the application you want to monitor is not supported by netdata, then you can develop your own plugin to monitor it using netdata. Netdata supports externally written plugins. It supports a wide variety of languages in which you can write a plugin. You can write your plugin in c, c++, go, lua, java, ruby. Any program that can print a few values to its standard output can become a netdata plugin. Read more here on how to create it.
 |
|---|
| Netdata monitoring Systemd Services |
There are already many tools that collect real time metrics about systems. But netdata outperforms everyone. No one matches the speed and efficiency of Netdata. There is always some latency using other tools, 5 seconds or 10 seconds. And if you want to collect per second metrics using them, that very same tool will start giving performance issues and will misbehave. Netdata is built for per second collection. Ofcourse you can configure your netdata for longer intervals also, but it is very suitable for per second collection. In layman’s terms, you can say that it is born for per second collection.
The metrics are collected by the internal statsd server. This statsd server is really powerful and fast, it can interact with any kind of system and application and collect metrics from them. It can handle 1,200,000 metrics per second(200 mbps). The calculated latency of the metric to be shown on the dashboard is 3 milliseconds !! in Netdata. That means the dashboard is updated in less than 3 milliseconds. The main reason for this lightning fast speed is that it does not make use of disk memory in its operations. The metrics are all stored in RAM. And there is no need to worry about the amount of RAM being used by netdata metrics. It hardly consumes about 15-25 MegaBytes of RAM in order to store these metrics.
Netdata is a very light tool. It consumes very little resources for it’s wroking and does not affect your system and other applications in any way. Netdata is so light weight that it is suitable for embedded systems also. It works perfectly for single core CPU systems. It mainly has 2 processes, one process to collect and process the metrics and other process to serve the web dashboard. At max, it’s cpu-time usage can go upto 7-8 %. The RAM usage has already been discussed, it can use upto 25 mb of your RAM for metrics storage. In it’s full usage, it may consume upto 50-70 MB of RAM( the maximum I have recorded is 62 mb). The web server serving the netdata dashboard is also really powerful. It can serve upto 180 users at a single time without having any kind of delays and without influencing your other application’s performance .
If at some moment, your system is facing difficulties in performance and resources, Netdata will not stand in any application’s way. It is configured such that it will be the first to get killed by the Memory Killer in case of Memory shortage. You can change this behaviour if you want to give Netdata more priority. If it occurs to you that netdata is consuming more resources and is utilizing more CPU, then you can also try lowering the data collection frequency. Another tweak is that it monitors itself. It shows the stats of it’s plugins and statsd server also. So, you can see that what is the status of the netdata itself.
 |
|---|
| Alerts in Netdata |
Another intriguing feature which every monitoring system must have is Alerting. Alerting is the most sought after feature in monitoring. Netdata has got health monitoring. Sysadmins and DevOps want to alerted when system is misbehaving. For example, when free memory on disk is less than 20%, it must alert us. Well, apart from these basic threshold values, Netdata has got whole lot more than that. It allows you to correlate different values. For example, not only just if A > 90, it also lets you make alerts on conditions like these if (A > 90 AND (B > 80 OR C < 40)) OR (D > 50 AND E < 30)). You can also make alerts on the rate of change also, like if (A(now) - A(30 mins ago) / (30 * 60)) > 50, it is helpful in database transaction rates and web server requests. You can make use of simple mathematical functions like max, min and avg on the metrics. It has various levels of the alarms like, WARNING, CRITICAL, CLEAR, UNDEFINED etc. [Read here all of them] (https://github.com/firehol/netdata/wiki/health-configuration-reference#alarm-statuses)
Netdata has support for these kinds of alerts. But better thing is you don’t even need to configure these(not all you want). **Netdata comes with pre-defined alarms for detecting the most common problems **. It comes with already configured alerts for the following scenarios :
- It will trigger alarms when the applications it monitors stop.
- It will detect network interfaces errors.
- It will detect disks not catching up with the load they are offered.
- It will detect low disk space on any disk.
- It will even predict in how many hours your system is going to be out of disk space and notify you if it is less than 48 hours.
- It will alert you if your system is running low on entropy (random numbers pool).
If you need to configure alarms on your own metrics threshold, you can configure them.
But how can it notify you ? By default, it will give you browser notifications. But it has support to alert you on various platforms also, which are listed below:
- email messages
- slack.com team collaboration
- Discord team collaboration
- pushover.net push notifications
- pushbullet.com push notifications
- telegram.org push messages
- PagerDuty notifications
- Twilio SMS notifications
- Messagebird SMS notifications
You can easily configure the methods to send and receive notifications by editing the config files. Add the required webhook URLS, Generic Keys, email receiver and email sender etc.
Backend Databases for Netdata Metrics
Netdata is made for live monitoring. It stores your data of some hours only. If you want to store data for more time, it will consume more RAM( 350mb for 1 day approx). This is the only difficulty with Netdata. It has memory limitations if you want to store data for a longer period of time.
But there is another and a better workaround for this situation when you want to store system metrics for a longer period. You can configure Netdata to store it’s metrics to some Time Series database. Netdata can push it’s metrics to many Time Series Database at regular intervals. It has support for following Time Series Database,
-
Graphite. Graphite data format is also accepted by many other databases like Graphite, InfluxDB, KairosDB, Blueflood, ElasticSearch via logstash tcp input and the graphite codec. So, you can send metrics to these backends also.
-
Opentsdb. Opentsdb data format is also accepted by OpenTSDB, InfluxDB, KairosDB, etc.
-
json document DBs. metrics are sent to a document db, JSON formatted.
-
prometheus.
At one time, it can send only metrics to only 1 backend. The sending of metrics to these databases has no impact on the performance of Netdata.
Many data modes are available for sending the data to backends. You can choose the mode on what metrics you want to send to backend database. You can choose collected, average, sum/volume modes. Collected sends the latest collected value in the selected interval. Average sends the average of the interval you select and Sum sends the sum of all values of the selected interval. It also monitors the backend operations. It also configures alarms for monitoring the backends.
I have successfully used InfluxDB as a backend and it works very smoothly. Then you can use Grafana to see the historical netdata metrics by adding influxdb as a data-source in Grafana. Here is a blog if you need help setting it.
Netdata is a perfect modern day tool made for DevOps and Sysadmins. It has made the life of DevOps and Sysadmins easy in a way. It is only going to get better. It has got donations from various companies recently, so, expect more improvements. I strongly recommend it.
I hope that like Netdata, this blog post also proves to be helpful. If you found it worth reading, don’t forget to share it.